Ask a group of riders what they think Functional Threshold Power (FTP) is and you will probably get the answer that it is the maximum power that they can hold on a steady state effort for an hour. FTP has been the datum from which every other physiological marker has been measured. Power training zones are all set as a percentage of FTP, mostly in line with the methodology set out by Andrew Coggan and Hunter Allen.
However as a coach who has conducted a lot of performance tests and has been training with power for a number of years, I always knew that this explanation was wrong, at least for me and the vast majority of riders I tested.
How did we arrive at an FTP figure? Well there are a number of different tests that all seek to arrive at a number that can be extrapolated into an FTP. 95% of a 20 minute time trial power, 90% of a VO2max effort. However the results from these tests tended to overestimate the power that a rider could hold for 60 minutes in many cases.
So why did we not all just do a 60 minute time trial test? Basically because it would be too painful and too difficult to pace for the majority of riders.
Here we can see how a riders FTP can change over a course of a season. The orange FTP line ebbs and flows as the amount of training increases and decreases (the blue bars). It goes up when we do more training and falls when we take time off or reduce training.

I know from my own data and that of others that different riders can hold their FTP power for different periods of time. This is down to the type of training you are doing or the type of riding or racing that you are doing, or just your physiology. If all you ever do is 2x20min intervals it is unlikely that you will be able to hold your theoretical FTP for much longer than 30 minutes. In contrast if you are racing criteriums then it is pretty likely that you can hold your FTP for closer to 60 minutes.
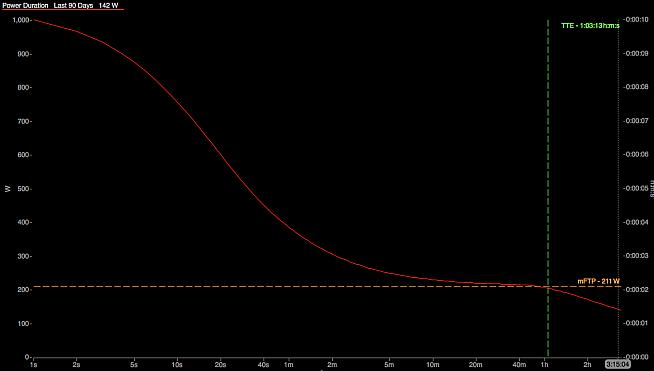
We now have the analytical capability to not just measure FTP, but also to see how each rider is different in terms of their ability to hold it. So we now look at FTP in two dimensions rather than one. Sustainable power or FTP and duration or time to exhaustion - TTE.
Let's look at two riders.
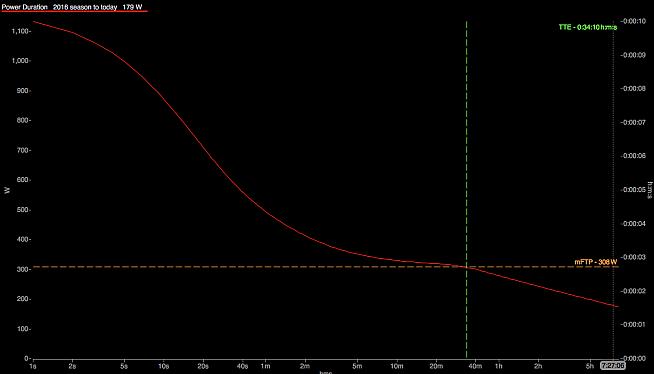
Rider A below has a relatively high FTP but the point at which power starts to fall away significantly on his power curve is around 34 minutes. In the new world we can now say that this rider has a sustainable power of 308w for around 34 minutes.


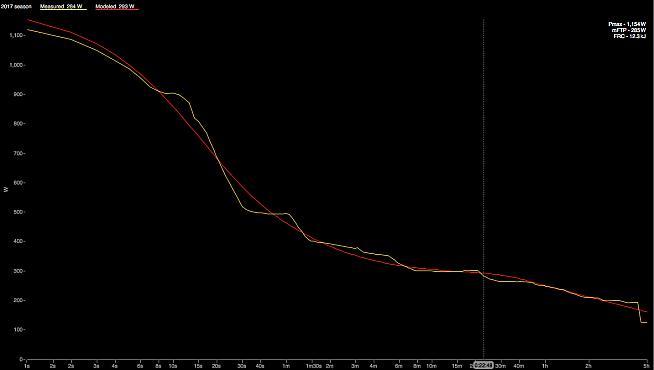
Below is a graph showing a riders predicted power curve (red line) vs actual observed maximal power outputs (yellow line) at different time periods. This is probably one of the most powerful tool we as coaches have at our disposal. Here we can see where our rider either outperforms or underperforms the predicted power. Depending on a riders objectives we can design specific programmes and workouts that target areas of underperformance. I have highlighted the area around 22 minutes. Here you can see that this rider underperforms predicted power from 22 mins to around 40 mins. Given this riders objective of taking part in the Maratona dles Dolomites, with several climbs lasting 20-60 minutes, then this is an area we need to improve.

If you have any questions then as always drop me a line at [email protected]
Good luck
Rob Wakefield is a fully qualified Level 3 Cycling Coach with the Association of British Cycling Coaches and founder of Propello, a cycling focused health and fitness business delivering Performance Training Programmes and Bespoke Coaching to cyclists anywhere in the world.
All cyclists who are looking to improve their speed, endurance or strength will benefit from a structured training programme. Propello Training will improve how your muscles, lungs and heart work and will enable your body to transport and utilise fuel effectively - making you faster and stronger for longer.
Click here to learn more about Propello.
0 Comments


